Torn between a walkable Pittsburgh neighborhood and a little more yard in the suburbs? You are not alone. Many buyers in Allegheny County weigh cost, space, commute time, schools, and day-to-day convenience before picking a side. In this guide, you will get a clear, fact-based way to compare city and suburban options, plus a simple scorecard you can use on any listing. Let’s dive in.
Market snapshot: price and pace
Pittsburgh stays one of the country’s more affordable major metros. Recent reporting shows the city’s median sale price around $213,056 as of January 2026. Across Allegheny County, the median listing price was near $249,900 in late 2025. Neighborhoods and suburbs vary a lot, so always compare specific areas rather than countywide averages.
Affordability is a key strength. A 2024 analysis found buyers in the Pittsburgh metro needed about 25.3% of median household income to buy a median-priced home, which is below the common 30% guideline many households target. Days on market in the city often range around 70 to 90, though that changes by season and neighborhood. Cash buyers remain active, which can affect competition on entry-level and turnkey homes.
Bottom line: both city and suburbs can be cost-effective relative to many metros. Your choice usually comes down to the tradeoff between location, space, and total monthly cost.
What you get: homes and lots
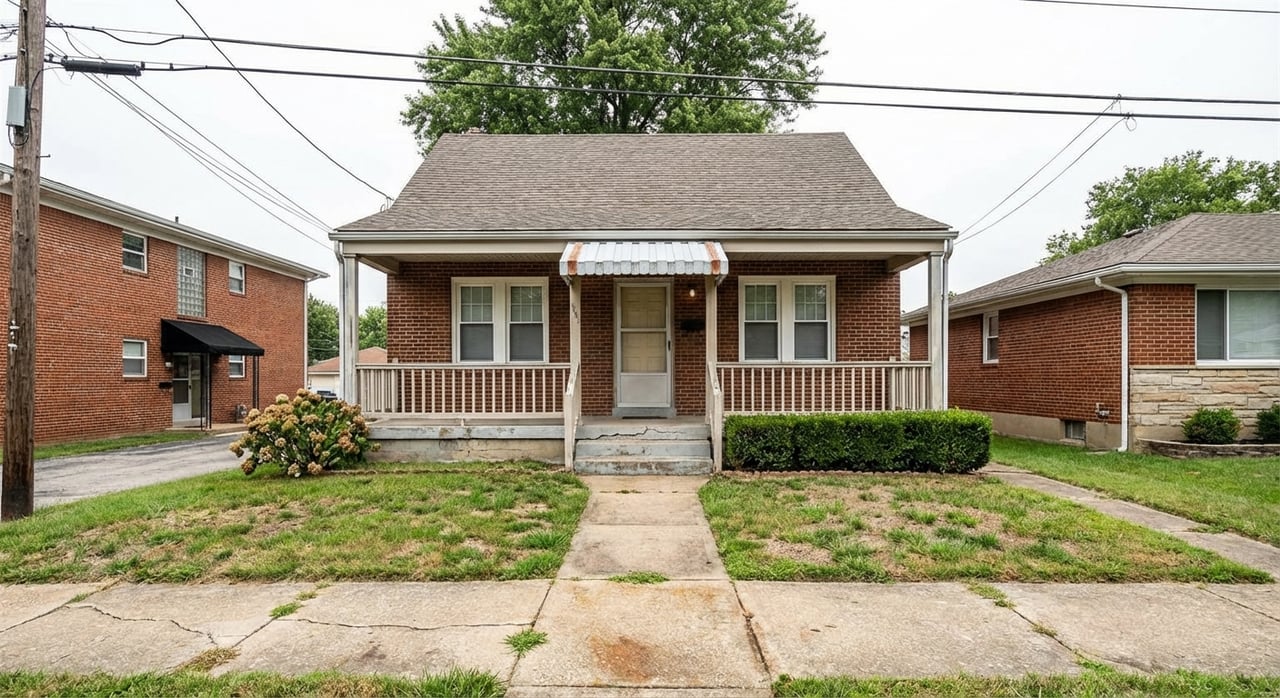
City neighborhoods often feature older homes with character. Many blocks include pre-1940 brick rowhouses, duplexes, and early 20th-century singles. That historic fabric is part of the city’s charm and renovation market. For context on the region’s older housing stock, the Pittsburgh History & Landmarks Foundation offers useful background on preservation and architectural eras. You can explore their resources on older homes and neighborhoods at the foundation’s blog and archives at Pittsburgh History & Landmarks Foundation.
In close-in city areas like Shadyside, Squirrel Hill, and Point Breeze, you will often see smaller lots roughly 0.06 to 0.19 acres. Suburban properties typically trend larger, especially in places like Mt. Lebanon or Upper St. Clair, where many single-family homes fall in the 0.2 to 0.6 acre range, with some even larger. Builders in outer suburbs also offer more modern floor plans, two-car garages, and more single-level or flexible layouts.
City living tradeoffs
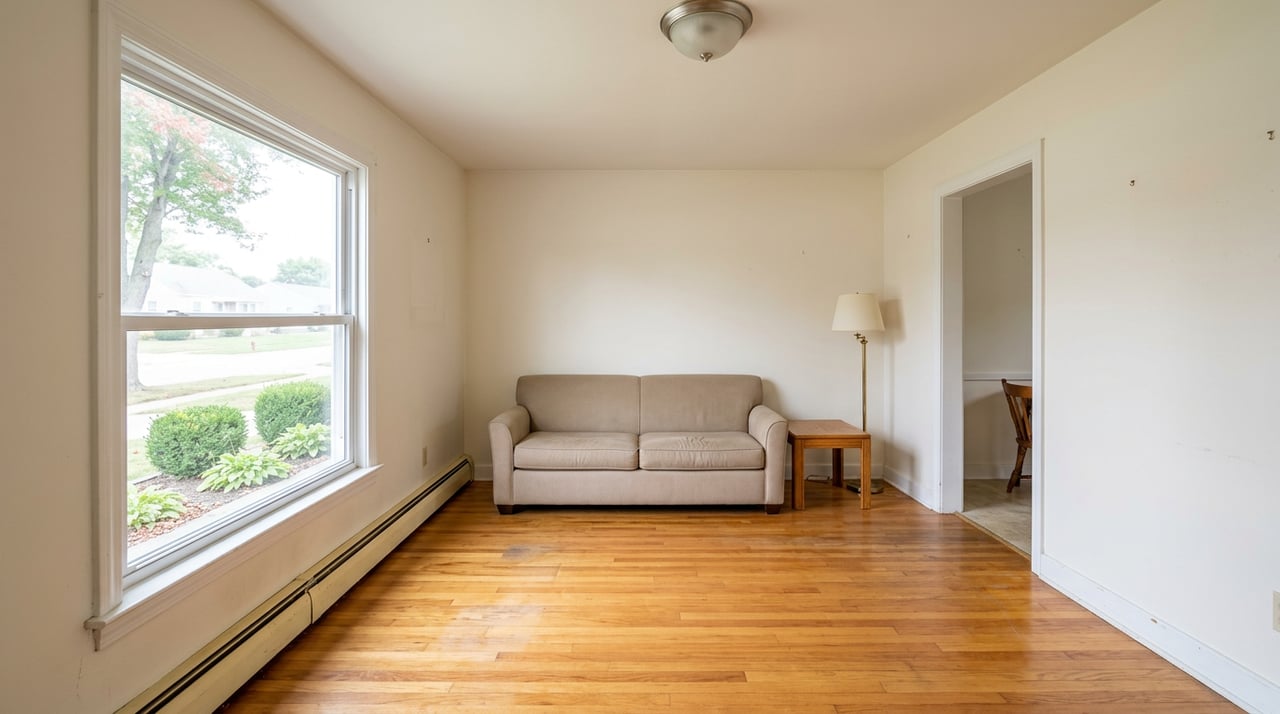
- Pros: walkability to dining and services, shorter average commute times, strong transit coverage on major corridors, and smaller yards that reduce outdoor maintenance.
- Considerations: older mechanicals or systems can require updates, off-street parking may be limited on some blocks, and lot sizes can limit additions or outbuildings.
Suburban living tradeoffs
- Pros: more interior square footage and yard space, driveways and garages, and more newer-construction options that may reduce near-term renovation.
- Considerations: more driving for daily needs, longer average commute times in many cases, and higher lawn and exterior maintenance.
Commute, transit, and walkability
Commute time is one of the biggest quality-of-life factors. U.S. Census estimates show the mean travel time to work is about 22.7 minutes in the city of Pittsburgh and 25.2 minutes for Allegheny County overall. You can review local commute metrics in U.S. Census QuickFacts.
Transit coverage is strongest around the urban core. Pittsburgh Regional Transit runs buses, the light-rail T, inclines, and park-and-ride lots. If transit is part of your plan, study current route maps and schedules, since service can change. Start with Pittsburgh Regional Transit’s system resources.
Practical tip: measure door-to-door commute time, not just miles. Parkways and river crossings can back up during peak hours, and bus or rail headways matter if you are car-light or car-free.
Schools, taxes, and utilities
If schools are a factor, compare at the district and address level. Local coverage notes that several inner-ring suburban districts often appear near the top of statewide rankings, while Pittsburgh Public Schools offers magnet and specialty programs within the city. Always confirm your exact school options and boundaries for the specific parcel you are considering. A quick snapshot of district-level comparisons is available via local district ranking coverage.
Property taxes in Pennsylvania include county, municipal, and school district millage. Allegheny County increased its county millage to 6.43 mills in 2025, which affects all property owners in the county. School district rates vary, and they are often the largest part of the bill. Before you make an offer, review the parcel’s actual tax history and current millage breakdown. You can find county tax information and contacts through the Allegheny County Treasurer.
Utilities and services differ by municipality. In the city, water and sewer are typically through the Pittsburgh Water and Sewer Authority, while electricity is often through Duquesne Light. In the suburbs, different authorities and providers may apply. Rates, stormwater fees, and service structures vary, so include them in your monthly cost estimate.
Safety, flooding, and maintenance
Safety patterns vary by neighborhood and municipality. County-level summaries indicate violent and property crime rates around or below national averages in recent snapshots, but you should review local data for any address you are considering. You can scan county-level context at CrimeExplorer and review recent city incidents through the open-data police incident blotter dataset. Local police departments and community meetings are also useful context.
Flooding is a real consideration in a river city. Local reporting points to increasing rainfall intensity and expanding flood risk footprints across parts of Allegheny County. If a property is near rivers, streams, or low-lying valleys, review FEMA flood maps, obtain elevation details if needed, and budget for insurance where required. A helpful overview of the region’s flood risk trends appears in this Pittsburgh-area flood risk report.
Maintenance varies by property type. Older city homes may need updates to roofs, wiring, plumbing, or masonry. Suburban homes may have larger exterior upkeep and landscaping. During inspections, ask for service records and factor projected repairs into your total cost.
A simple scorecard for your short list
Use this 1 to 5 scoring method for each property. Score each category, then compare totals across city and suburban options. A higher total means a better fit for your needs.
- Price and monthly cost. Include mortgage, taxes, utilities, and any HOA or municipal fees. Where to check: Allegheny County Treasurer.
- Commute and transit. Measure peak door-to-door time and transit options. Where to check: Pittsburgh Regional Transit maps and schedules.
- Space and yard. Compare interior square footage, storage, parking, and lot size.
- School options. Verify district, magnet, charter, or private choices for the parcel. Where to scan context: Local district ranking coverage.
- Walkability and nearby amenities. Look for daily needs within a short walk or drive.
- Renovation tolerance and home age. Note systems, roof age, and foundation or masonry. Preservation context: Pittsburgh History & Landmarks Foundation.
- Risk review. Consider floodplain, slope, stormwater rules, and local incident trends. Regional overview: Pittsburgh-area flood risk report. Data context: County crime summaries and city incident dataset.
Example: city rowhouse vs suburban single-family
Here is how two common profiles might score. Use this as a template rather than a verdict.
City rowhouse in a walkable neighborhood
- Price and monthly cost: 4 (lower price point helps overall affordability)
- Commute and transit: 5 (shorter average city commute and more transit options nearby)
- Space and yard: 2 (smaller footprint and limited outdoor space)
- School options: 3 (confirm parcel-level options and any magnet eligibility)
- Walkability and amenities: 5 (daily errands and dining often close by)
- Renovation tolerance and home age: 2 (older systems likely, plan for updates)
- Risk review: 3 (check for slope, retaining walls, and local incident trends)
- Total: 24/35
1990s detached home in an inner-ring suburb
- Price and monthly cost: 3 (purchase price may be higher; verify total tax bill)
- Commute and transit: 3 (often a longer drive, park-and-ride may help)
- Space and yard: 5 (more interior space, garage, and larger lot)
- School options: 4 (district-level rankings often score well; always confirm boundaries)
- Walkability and amenities: 3 (downtown cores can be walkable, most errands by car)
- Renovation tolerance and home age: 4 (newer systems reduce near-term work)
- Risk review: 4 (validate floodplain status and local incident data)
- Total: 26/35
In practice, your priorities drive the winner. If space and a yard top your list, a suburban home often wins. If time savings and walkability matter more, the city rowhouse may come out ahead.
How to choose your next step
- Start with your non-negotiables. List the three things you will not compromise on, like commute time, bedroom count, or a garage.
- Run the scorecard on three to five homes in both settings. This clarifies tradeoffs fast.
- Get parcel-level facts. Pull the actual tax bill, confirm school boundaries, review transit options, and check floodplain status.
- Plan for total cost. Include maintenance, utilities, insurance, and likely updates over the first five years.
If you want a local sounding board to pressure-test your plan, schedule a quick consult. Our team can help you compare apples to apples and line up showings that fit your scorecard.
Ready to find the right fit in Pittsburgh or the suburbs? Reach out to Christine Laboon to start your plan today.
FAQs
Is the city of Pittsburgh always cheaper than the suburbs?
- No. While the metro is broadly affordable, some city neighborhoods have prices close to or higher than inner-ring suburbs. Compare neighborhood medians and specific listings.
How do average commute times compare between city and suburbs?
- Census estimates show a mean commute of about 22.7 minutes in the city and 25.2 minutes countywide. Your door-to-door trip will vary by route, time of day, and transit access. See U.S. Census QuickFacts.
Will I pay more property tax in the suburbs?
- It depends. The county millage applies everywhere and increased to 6.43 mills in 2025, but school district rates vary. Always review the parcel’s actual bill via the Allegheny County Treasurer.
Are there strong public school options in the city?
- Pittsburgh offers magnet and specialty programs within the district, and families also consider charter and private options. Suburban districts often rank higher at the district level, so confirm boundaries for each address. See local district ranking coverage.
How do lot sizes typically differ between city and suburbs?
- Many city lots run roughly 0.06 to 0.19 acres in close-in neighborhoods, while many suburban lots fall around 0.2 to 0.6 acres or more. Always confirm with parcel data for each property.